Monitoring Home Internet Performance with a Raspberry Pi
· Raspberry Pi
I got mad at my ISP. Now you can get mad at yours with this one simple trick!
I recently noticed a drop in performance with my home internet. Calls have been choppy, videos buffer a lot, and the overall quality of connection has noticeably decreased. I tried troubleshooting things on my local network to the best of my ability but the issues persisted. Even connecting directly to the router, I continued to see high latency and packet loss.
So, like most normal people, I decided to set up a Raspberry Pi to run network tests and collect data to better understand my network issues. I flashed a fresh image of Raspberry Pi OS onto an old 3 Model B+ and decided on a few tools to use for the job: speedtest-cli, mtr, InfluxDB, and Grafana.
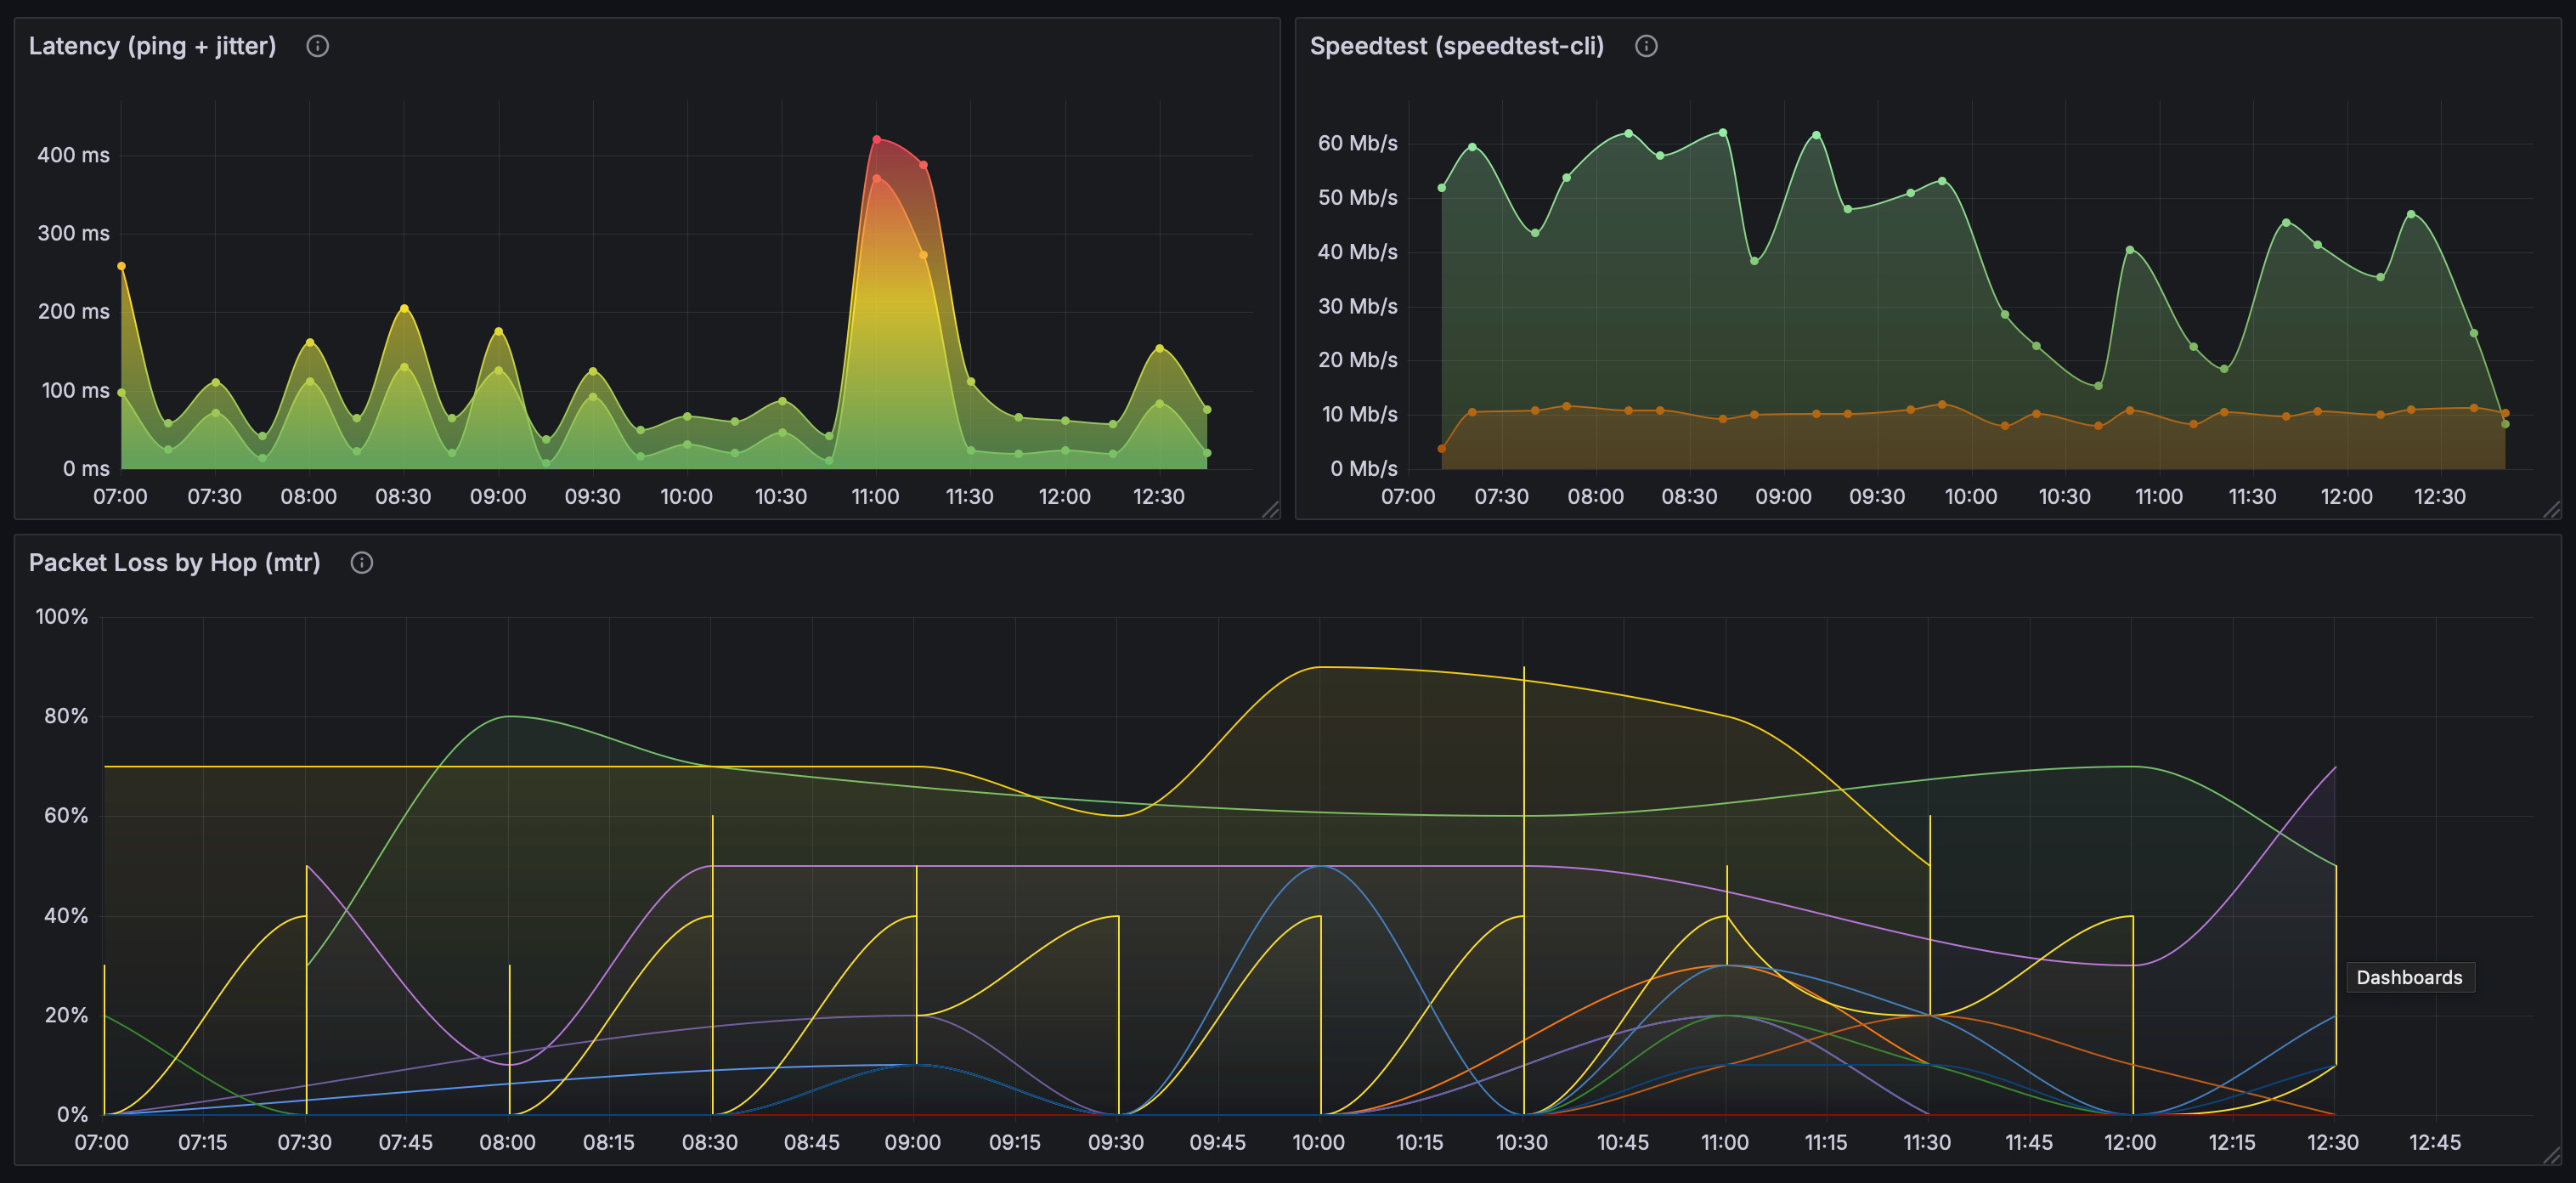
I’ll explain how and why I use each below. But the desired outcome is a dashboard where I can identify spikes or trends that indicate ongoing problems with my internet connection. I can share that information with my ISP in an attempt to diagnose and hopefully resolve the issue.
💻 Set Up the RasPi
We’ll first need to prepare our Raspberry Pi. I used Raspberry Pi Imager to start fresh with a clean install of Raspberry Pi OS. If you use the imager, you can follow its prompts to set the hostname, enable SSH access, and configure additional settings. For this use case, make sure to enable SSH so you can login to the Pi remotely.
After the Pi is up and running, you’ll need to connect it to your home network. If possible, I suggest connecting directly to your router via ethernet. By doing so, you can rule out issues related to wireless connectivity.
Once your Raspberry Pi is connected, you can login via SSH with user@hostname or user@ipaddress, where hostname is the hostname or ipaddress is the IP assigned to your Raspberry Pi. If you are unsure what either of these are, you can run arp -a 1. That command will return something like the following:
raspberrypi.lan (192.168.1.100) at xx:xx:xx:xx:xx:xx on en0 ifscope [ethernet]From that response, you can pull the hostname (raspberrypi) or the IP (192.168.1.100). Then you can connect with ssh user@hostname.
📦 Install Packages
Once you’re logged in via SSH, you’ll need to install the tools we are going to use. We’ll use ping, which is included in Raspberry Pi OS, to test latency. We’ll use speedtest-cli to test upload and download speeds. And we’ll use mtr to check for packet loss.
We can store the results from each of these tools using InfluxDB, which is a time series database built to handle metrics, events, and logs. Finally, we’ll use Grafana to create a dashboard to display these results over time and tie everything together.
# Update package list
sudo apt update

# Install speedtest-cli
sudo apt install speedtest-cli

# Install mtr
sudo apt install mtr

# Install InfluxDB
sudo apt install influxdb

# Install the InfluxDB client
sudo apt install influxdb-client

# Install jq (we'll need this to process some JSON)
# ref: https://github.com/jqlang/jq
sudo apt install jq

# Install bc (we'll need this for calculations)
sudo apt install bc
The Grafana package isn’t currently included in the default Raspberry Pi OS repositories. So we’ll need to add it ourselves:
# Add the Grafana GPG key
sudo apt install -y gnupg2 curl
sudo mkdir -p /etc/apt/keyrings
curl -fsSL https://packages.grafana.com/gpg.key | sudo gpg --dearmor -o /etc/apt/keyrings/grafana.gpg

# Add the Grafana APT repository
echo "deb [signed-by=/etc/apt/keyrings/grafana.gpg] https://packages.grafana.com/oss/deb stable main" | sudo tee /etc/apt/sources.list.d/grafana.list
Now we can update our package list and install Grafana:
# Update our package list again
sudo apt update

# And we can install Grafana
sudo apt install grafana
We’ve got everything we need installed now and we can start putting it all together.
🗄️ Set Up InfluxDB
Let’s start the InfluxDB service. This is what we’ll use to create the database that will store our test results. We can start the service and create a database like so:
# Start InfluxDB service
sudo systemctl start influxdb
sudo systemctl enable influxdb

# Create a database
influx -execute 'CREATE DATABASE network_monitoring'
📈 Set Up Grafana
We’ll use Grafana to visualize and display our data. We’ve installed it above, now we need to start the service and configure it to use the InfluxDB database we just created:
# Start Grafana service
sudo systemctl start grafana-server
sudo systemctl enable grafana-server
By default, Grafana will use port 3000. You can access the web UI via browser by hostname and port: http://raspberrypi.local:3000/login. Or you can access via IP address and port like so: http://192.168.1.100:3000.
The default login credentials for Grafana are:
- Username:
admin - Password:
admin
Use those to login and you’ll be prompted to set a more secure password. After setting a new password, we can move on to the next step. We’ll return to Grafana a bit later to create the dashboards.
🧪 Write the Tests
With everything in place ready to catch our data, we can write our tests. We’ll just use some simple bash scripts for each. Let’s start by writing a script to run our speedtests.
Test Upload and Download Speeds
Raspberry Pi OS ships with GNU nano and vi, so we can use either to create and edit our file. I’ll create and open a new file for our speedtest script with:
vi speedtest.shIn this script we’ll run speedtest-cli, capture the results as JSON (this is where we need jq), and then write them to our database. InfluxDB uses port 8086 to run its HTTP service by default, so the script assumes we’re using the default settings. I’ve included some basic logging as well, which will help us troubleshoot issues later on if need be.
[!WARNING] You’ll need to update the filepaths in these scripts (e.g.
/app/logs/) to match your directory structure.
#!/usr/bin/env bash

# Log file
LOGFILE="/app/logs/speedtest.log"

# Ensure the PATH is set correctly
export PATH=/usr/bin:/bin:/usr/local/bin

# Check for required commands
for cmd in speedtest-cli curl jq; do
  if ! command -v $cmd &> /dev/null; then
    echo "$(date): Error: $cmd command not found" >> $LOGFILE
    exit 1
  fi
done

# Log the start of the test
echo "$(date): Starting speedtest" >> $LOGFILE

# Run speedtest-cli and capture the output
result=$(speedtest-cli --json 2>> $LOGFILE)

if [[ -n $result ]]; then
  download=$(echo $result | jq .download)
  upload=$(echo $result | jq .upload)
  ping=$(echo $result | jq .ping)

  # Convert download/upload speeds to Mbps
  download_mbps=$(echo "scale=2; $download / 1000000" | bc)
  upload_mbps=$(echo "scale=2; $upload / 1000000" | bc)

  if [[ -n $download_mbps && -n $upload_mbps && -n $ping ]]; then
    # Write results to InfluxDB
    response=$(curl -s -o /dev/null -w "%{http_code}" -XPOST 'http://localhost:8086/write?db=network_monitoring' \
      --data-binary "speedtest,host=raspberrypi download=$download_mbps,upload=$upload_mbps,ping=$ping")

    if [[ $response -eq 204 ]]; then
      echo "$(date): Download: $download_mbps Mbps, Upload: $upload_mbps Mbps, Ping: $ping ms written to InfluxDB" >> $LOGFILE
    else
      echo "$(date): Error: InfluxDB write failed with HTTP $response" >> $LOGFILE
    fi
  else
    echo "$(date): Error: Invalid data from speedtest-cli" >> $LOGFILE
  fi
else
  echo "$(date): Error: speedtest-cli did not return any result" >> $LOGFILE
fi

echo "$(date): Speedtest completed" >> $LOGFILE
To ensure you saved your file (it’s esc then :wq) you can cat speedtest.sh2 and check the output. That should give you the contents of the file we just created.
With our script created, we need to make it executable so we can run it:
chmod +x speedtest.shLet’s take it for a test drive with ./speedtest.sh. It may take a minute, but you should see the results of the speedtest after running it manually. Later on, we’ll use cron to schedule it to run automatically.
Test Latency
This might be overkill since speedtest-cli can capture ping. But I wanted to include a dedicated ping test for a couple reasons. A separate test allows me to separate concerns. And since the ping test alone will be lighter than a full speedtest, I can run it more frequently to establish a tighter baseline.
Like our speedtest, let’s create a new file for our ping test with our editor of choice:
vi pingtest.shOur script as written below will ping Google’s Public DNS at 8.8.8.8 ten times and capture the average round-trip time and jitter. Then it will write those results to the database.
[!INFO] Remember to update the filepaths so they match your directory structure. You can also adjust the count and target IP address if you’d like3
#!/usr/bin/env bash

# Log file
LOGFILE="/app/logs/pingtest.log"

# Ensure the PATH is set correctly
export PATH=/usr/bin:/bin:/usr/local/bin

# Check for required commands
for cmd in ping curl; do
  if ! command -v $cmd &> /dev/null; then
    echo "$(date): Error: $cmd command not found" >> $LOGFILE
    exit 1
  fi
done

# Log the start of the test
echo "$(date): Starting ping test" >> $LOGFILE

# Run ping test and capture the output
ping_output=$(ping -c 10 8.8.8.8 2>> $LOGFILE)

# Extract ping statistics
if [[ $ping_output =~ ([0-9]+\.[0-9]+)/([0-9]+\.[0-9]+)/([0-9]+\.[0-9]+)/([0-9]+\.[0-9]+) ]]; then
  avg_ping=${BASH_REMATCH[2]}
  jitter=${BASH_REMATCH[4]}

  # Write results to InfluxDB
  response=$(curl -s -o /dev/null -w "%{http_code}" -XPOST 'http://localhost:8086/write?db=network_monitoring' \
    --data-binary "pingtest,host=raspberrypi latency=$avg_ping,jitter=$jitter")

  if [[ $response -eq 204 ]]; then
    echo "$(date): avg_ping=$avg_ping jitter=$jitter written to InfluxDB" >> $LOGFILE
  else
    echo "$(date): Error: InfluxDB write failed with HTTP $response" >> $LOGFILE
  fi
else
  echo "$(date): Error: Failed to parse ping statistics" >> $LOGFILE
fi

echo "$(date): Ping test completed" >> $LOGFILE
As with the above, we’ll make it executable with chmod +x pingtest.sh. Then we can double check the contents of the file with cat pingtest.sh and take it for a manual test drive with ./pingtest.sh.
Test for Packet Loss by Hop
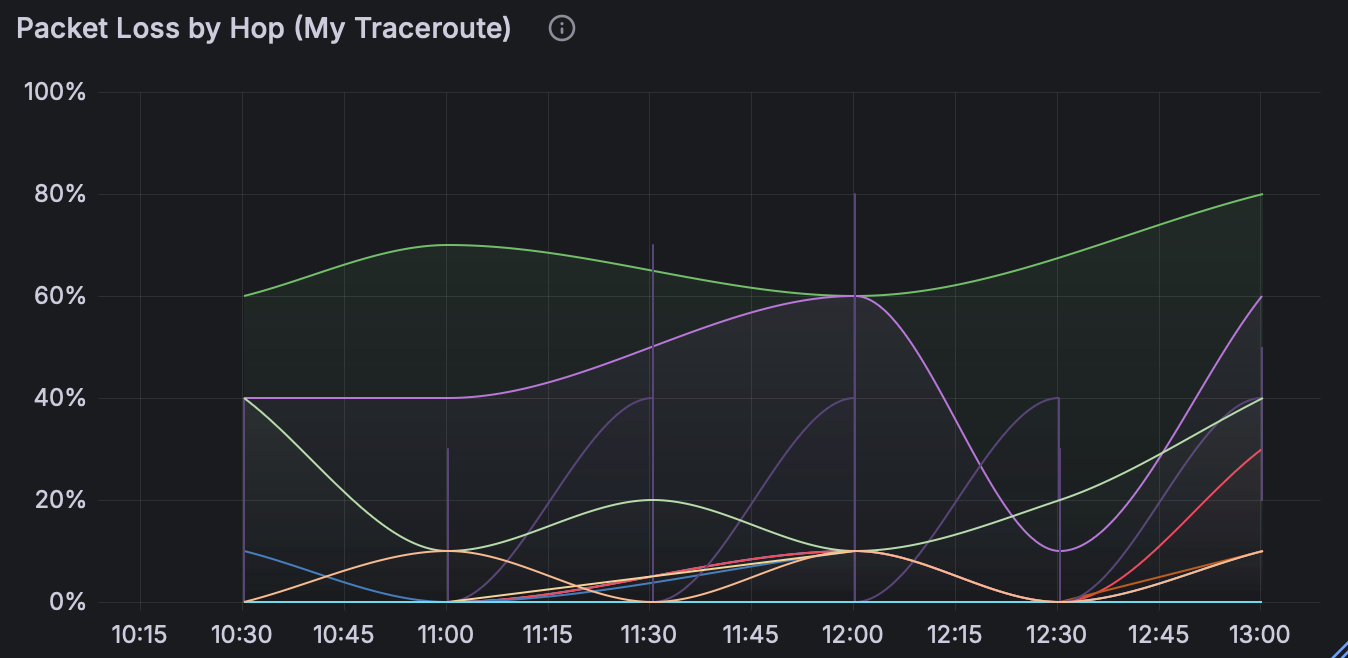
mtr (My Traceroute) combines the functionality of traceroute and ping into a single network diagnostic tool. It allows you to see latency and packet loss for each hop along the way to the destination whereas ping only shows the packet loss to the final destination. This is helpful in determining where packet loss is occurring along the route. You can use mtr to view live results or print them to a report. In our case, we’ll do the latter and store what we need from the reports in our database. First, let’s again create a new script:
vi mtrtest.shIn the script, we’ll configure mtr to run and extract packet loss for each hop by IP address. We’ll use the -r flag to output results as a report which we can then write to the database. Again, you can modify the parameters like count (-c) and target IP address (8.8.8.8) if you’d like 3.
#!/usr/bin/env bash

# Log file
LOGFILE="/app/logs/mtrtest.log"

# Ensure the PATH is set correctly
export PATH=/usr/bin:/bin:/usr/local/bin

# Check for required commands
for cmd in mtr curl; do
  if ! command -v $cmd &> /dev/null; then
    echo "$(date): Error: $cmd command not found" >> $LOGFILE
    exit 1
  fi
done

# Log the start of the test
echo "$(date): Starting MTR test" >> $LOGFILE

# Run mtr test and capture the full output
mtr_output=$(mtr -r -c 10 8.8.8.8 2>> $LOGFILE)

# Extract packet loss values and IP addresses for each hop
while IFS= read -r line; do
  if [[ $line =~ [0-9]+\.[0-9]+% ]]; then
    hop_ip=$(echo "$line" | awk '{print $2}')
    loss=$(echo "$line" | awk '{print $3}' | tr -d '%')

    if [[ -n $hop_ip && -n $loss ]]; then
      # Write each hop's packet loss to InfluxDB
      response=$(curl -s -o /dev/null -w "%{http_code}" -XPOST 'http://localhost:8086/write?db=network_monitoring' \
        --data-binary "mtrtest,host=raspberrypi,hop_ip=$hop_ip packet_loss=$loss")

      if [[ $response -eq 204 ]]; then
        echo "$(date): $hop_ip packet_loss=$loss written to InfluxDB" >> $LOGFILE
      else
        echo "$(date): Error: InfluxDB write failed with HTTP $response for $hop_ip" >> $LOGFILE
      fi
    else
      echo "$(date): Warning: Missing hop_ip or packet_loss for line: $line" >> $LOGFILE
    fi
  fi
done <<< "$mtr_output"

echo "$(date): MTR test completed" >> $LOGFILE
And once again, we can check the contents of the file with cat mtrtest.sh and make it executable with chmod +x mtrtest.sh. Then we can the script manually to test it with ./mtrtest.sh.
📅 Schedule the Tests
With our scripts ready, we can use cron to schedule them to run at regular intervals.
# Open crontab
crontab -e
[!INFO] You can adjust the timing for each test. For example, I run
speedtest.shandmtrtest.shevery 30 minutes andpingtest.shevery 15 minutes. Again, remember to change the/app/path to match your own.
# Run speedtest every 30 minutes
*/10 * * * * /app/scripts/speedtest.sh

# Run ping test every 15 minutes
*/15 * * * * /app/scripts/pingtest.sh

# Run mtr test every 30 minutes
*/30 * * * * /app/scripts/mtrtest.sh
If you’re unsure of the full path for your scripts, you can use realpath to find them. For example, we can find the path for our speedtest script like so:
realpath speedtest.sh
/app/scripts/speedtest.sh
🔌 Connect the Data
With our tests running and populating the database with their results, we can head back to Grafana to create a dashboard to visualize our findings.
Open Grafana again in your browser (e.g. http://raspberrypi.local:3000). First we need to connect Grafana to the datasource, which we created with InfluxDB earlier:
- On the left, head over to Connections => Add new connection.
- Select InfluxDB.
- In the top right, click Add new data source.
Most of the default values should suffice. We just need to add:
- URL:
http://localhost:8086 - Database:
network_monitoring
Now click Save & test. You should receive confirmation that the datasource is working and measurements were found.
🎨 Visualize the Results
With our data source connected, it’s time to create the dashboard. In the top right, click Build a Dashboard and follow these steps:
- Click Add Visualization.
- Select Influxdb as the data source.
- Scroll down to Queries.
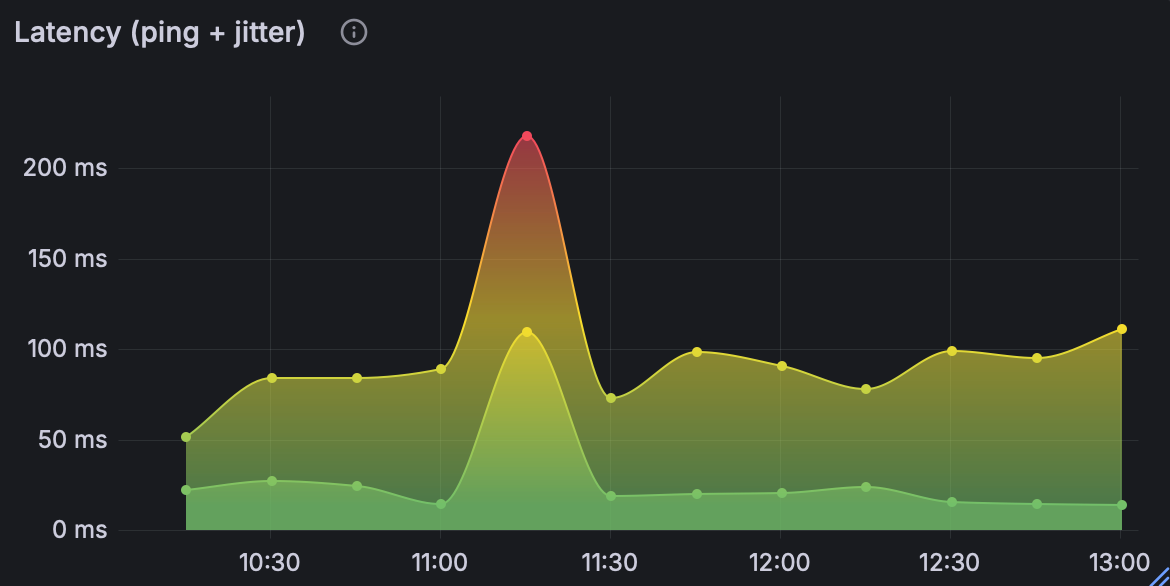
You’ll now need to build your query for each metric you want to visualize. For example, we can display results over time from our ping test by creating a panel with two queries. First, we’ll look at ping:
FROM pingtest
SELECT field (latency)
FORMAT AS Time series ALIAS ping
And second, we’ll look at jitter:
FROM pingtest
SELECT field (jitter)
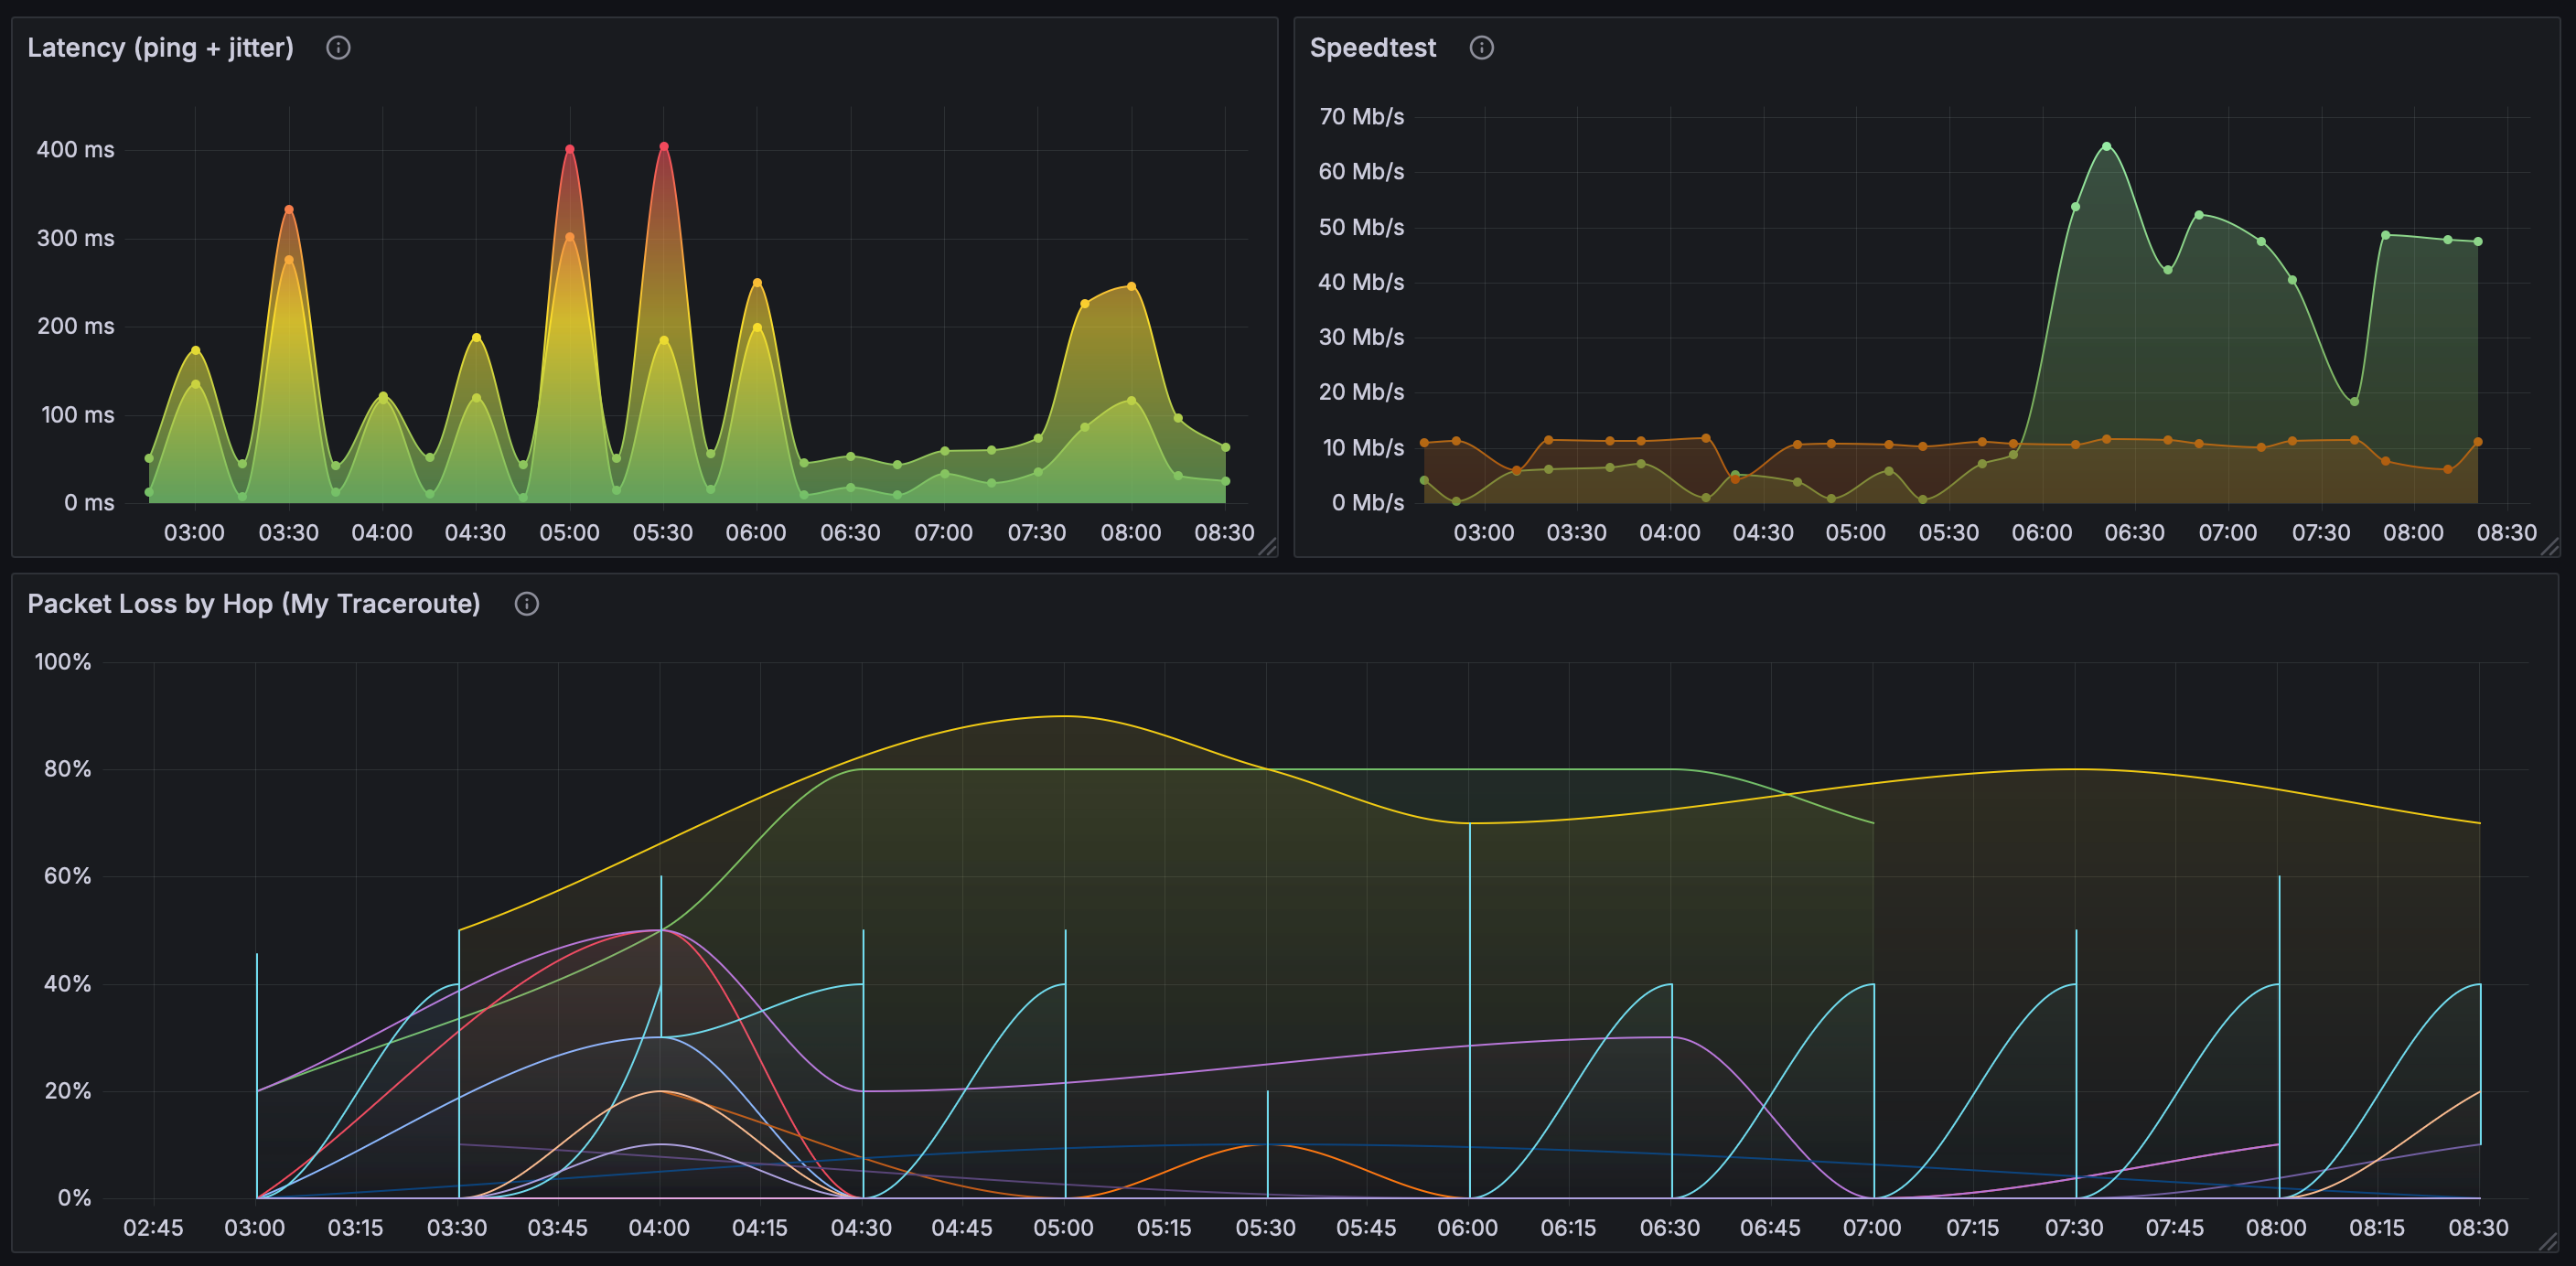
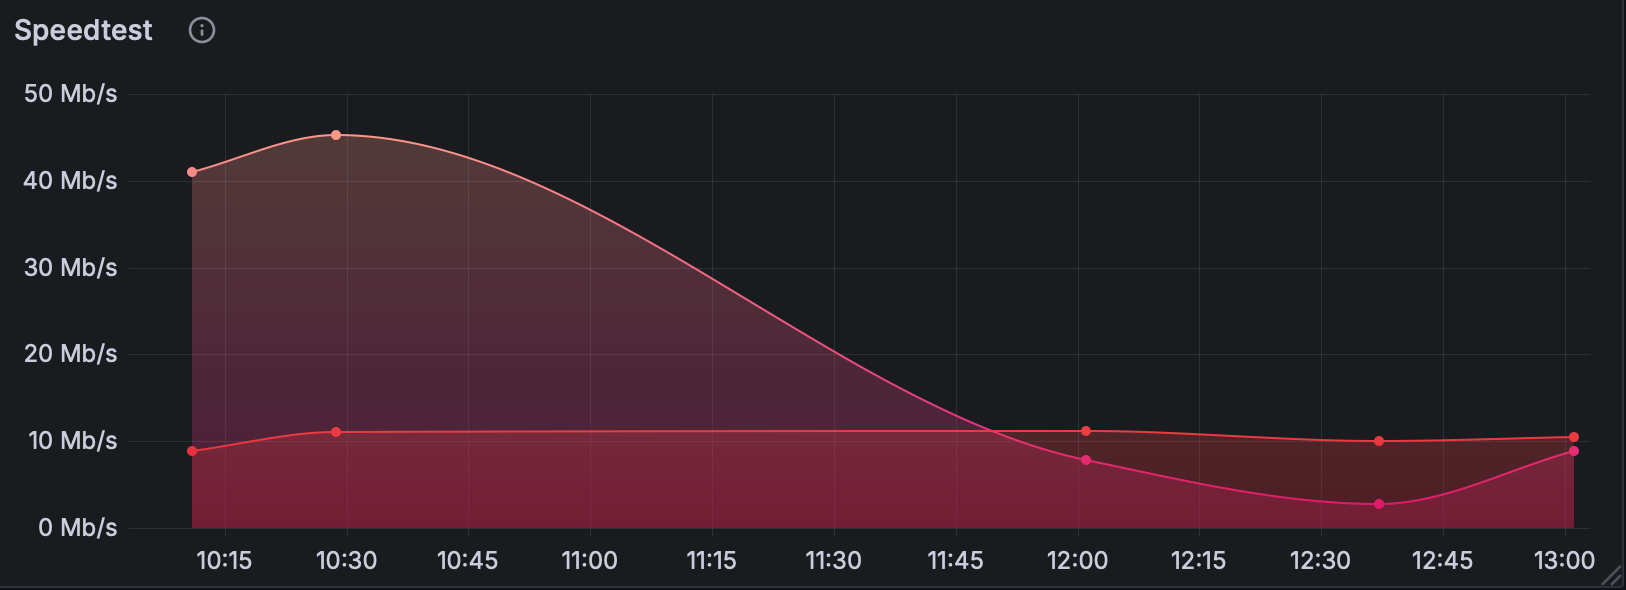
FORMAT AS Time series ALIAS jitterYou can customize the display options as much or as little as you’d like using the panel on the right. You can add a title, choose the graph style, and set units appropriately. When you’re happy with the look, you can save the panel and create two more for the speedtest and mtr test results following a similar process. I landed on the following:
🛠️ Troubleshooting
It took a little trial and error to get things running smoothly, but here are a few troubleshooting tips that helped me along the way.
Check the logs
We included basic logging for each of our scripts. Those logs are a good place to start to see if there are any errors. For example, we can check the speedtest logs with cat speedtest.log to see if the script is being run and completed successfully.
If there there aren’t any errors in those logs then we can check the cron logs with sudo journalctl -u cron. If all is well, we should see entries like the following:
Nov 14 02:30:01 raspberrypi CRON[6062]: (user) CMD (/app/scripts/speedtest.sh)
Nov 14 02:30:01 raspberrypi CRON[6060]: (user) CMD (/app/scripts/pingtest.sh)
Nov 14 02:30:01 raspberrypi CRON[6061]: (user) CMD (/app/scripts/mtrtest.sh)
Check File Permissions
If the scripts aren’t running as scheduled, check the file permissions to make sure they are executable. You can check the permissions for all shell scripts with ls4 like so:
ls -l *.sh
-rwxr-xr-x 1 user user  663 Nov 14 22:26 mtrtest.sh
-rwxr-xr-x 1 user user  769 Nov 14 22:26 pingtest.sh
-rwxr-xr-x 1 user user 1128 Nov 19 17:58 speedtest.sh
If any scripts don’t have execute permissions to run via cron, you can add them like so (where scriptname is the script in question):
chmod +x scriptname.shRun the Scripts Manually
If the permissions look good but tests still aren’t running, you can try testing the scripts manually. From the command line run ./scriptname.sh (where scriptname is the script in question) and see if it completes successfully. If it does, you may need to check that the syntax is correct in your crontab. You can use crontab -l to list current cron jobs. You can make changes with crontab -e as needed and then restart cron with sudo systemctl restart cron.
If you receive an error when running the scripts manually, we can rule out cron for now and instead use the error messages to diagnose the issue with script itself. Once the script runs manually without error, restart cron and see if the issue is resolved.
⏭️ What’s Next?
To date, my network issues persist and my ISP has shown no interest whatsoever in my Grafana dashboard (I know, right?). But it feels good to have my frustration captured with pretty charts and numbers! Eventually my ISP admitted they are experiencing issues with connectivity in my area due to outdated infrastucture that will not be updated soon and thus suggested that I find a new provider. Perhaps not the ideal outcome, but hey, at least I’m ready to thoroughly test my new provider’s service.
Footnotes
-
arpstands for Address Resolution Protocol and is a tool used in network administration to map IP addresses to MAC (Media Access Control) addresses of devices on a local network. When you runarp -a, it lists all the entries in the ARP table, showing the IP addresses and their corresponding MAC addresses. ↩ -
catis a standard Unix utility that reads files sequentially and outputs them to standard output. It’s handy to quickly check the contents of a file. ↩ -
For our
pingandmtrtests we’re using8.8.8.8which is Google’s Public DNS. We can generally trust that to be reliable. You could also use Cloudflare’s DNS Resolver at1.1.1.1or any other reliable host for these tests. ↩ ↩2 -
lsis a command to list computer files and directories in Unix and Unix-like operating systems.lsitself lists files and directories, the-lflag provides more detailed information, and*shmatches all files ending with.shin the current directory. ↩